
Few of us can be unaware of the Internet revolution: many of us now use electronic mail (email) as a first choice for a medium of communication, or use the WorldWide Web (www) for looking up train times, booking flights, choosing a new kitchen sink or simply browsing the wealth of information and knowledge available. The opportunities are seemingly endless and recently there has been growing interest in harnessing the Internet to help with wildlife recording. One of the key players in this has been the National Biodiversity Network (NBN), an initiative promoting the collection, exchange and use of biological records. It currently has over eighteen million species records available through its Website, the NBN Gateway. Now the Conchological Societies data joins those ranks; this article tells you more about exactly what that means.
What is the NBN Gateway?
The National Biodiversity Network (NBN) was formed with the aim of improving the exchange of Biodiversity data in order to support Conservation, Recording and Research. The NBN Gateway is a web site that allows data owners to expose their data but in a very controlled way. As well as allowing data to be exchanged it has a range of functionality including
• atlas style species distribution maps
• viewing a list of the species that have been recorded within a particular 10 km square
For reasons of sensitivity, not all the data on the Gateway are freely available – access is controlled by the data owner. The Gateway allows the owner to specify who can use their data and at what resolution. So, for example, the marine mollusc dataset owned by the Conchological Society can be viewed by everyone to the nearest 10km square but the detail of exactly where the record was made can be more tightly controlled by the Society.
Mollusc data on the Internet
A huge number of molluscan records can now be explored through a web browser using the NBN Gateway. For the first time some of the Conchological Society’s marine and non-marine records can be viewed by members on-line, as well as records from a range of other datasets. It’s the first time that so many mollusc records have been so easily accessible in one place and is the only facility of its kind in the world.
The non-marine records on the Gateway are mainly at 10km scale and reflect the data in Michael Kerney’s atlas, 1999. The marine data on the Gateway, which have recently been transcribed to Recorder 2002 format in order to be compatible with the wider biological recording community, are a minority of the Society’s total records and are principally focused around the English Channel with some additional data from scattered localities around the British coast. There is still a long way to go to complete the ‘keying in’ of the archive of paper records held by the Society and it is expected that this will be achieved aided by the voluntary efforts of the Membership. To see what is up there on the Gateway, you can start exploring the site right away by typing www.searchnbn.net into your browser:
• Species list for a 10km square
For example, have you ever wanted to see a list of the species that have been recorded within a particular 10km square? From the front page of the Gateway you can use the map to navigate to a 10km square and then see a list of the molluscs that have been recorded there. You can also refine the list and draw up only the records from particular datasets that you consider trustworthy (for example the datasets the Conchological Society has made available). All the datasets have descriptions available to help you choose those that are most appropriate for your purpose.
• Species distributions
You can use the Gateway to view the currently recorded distribution of a species. This allows you to produce atlas style maps for both non-marine and marine species. It also allows you to plot the data at different resolutions (scales) or for a particular area. You can also look at how the recorded distribution appears to be changing through time by plotting different dates in different colours. Later in the year we hope to have developed the Society’s own website to show the distribution maps along side accounts of the species and plan to give more information about this in the next issue of Mollusc World.
• Interacting with Records
If you want to look at the detail of the records behind the maps you can use the interactive map facility. For this the Society will need to have activated your access rights. This will then allow you to zoom in to a particular area of interest to you and, subject to the appropriate access rights that you have to the data, see exactly where the record was made. You can also select individual records and find out more about them. There are also facilities to allow you to overlay the map you have selected with the boundaries of protected sites (eg. Sites of Special Scientific Interest) or with the Land Cover Map 2000 (a habitat map for the UK). For datasets that you have sufficient access to you can also make comments on the validity of the records. This facility was used by the Spider Recording Scheme to validate their data ahead of the publication of their Distributional Atlas and we may use this option in a similar way for more detailed validation of the Society’s data.
THE FUTURE
The NBN Gateway is still being developed but its success is dependent on its growth through data being made available on it, particularly from societies such as the Conchological Society. The Gateway developers are always looking for ideas as to how it could be improved. You can do this by clicking on the Feedback button at the top of the window on your computer screen to send any ideas, or to communicate any problems you are experiencing.
So……….. if you have access to the Internet why not visit the NBN Website and see what you think. Try and search for the currently recorded distribution of a particular species – it may be that you have records to add? An excellent use of the Gateway is to help you plan your next field trip. The inset provides some quick pointers to starting to use it.
Step by Step Guide to getting started on the Gateway
To look at the distribution of a species –
1. On the Main Page of the NBN Site type in part of the name of a species you are interested in and press “Search” (Hint: You can use a five letter abbreviation i.e. the first two letters of Genus and first three of the Species so “Helicella itala” would be “Heita").
2. Select the “Grid map” of the species to view its distribution. Note that at the bottom of the page you can select the datasets that are used to create the map – you may only want to use the Conchological Society data or you may wish to search several datasets simultaneously.
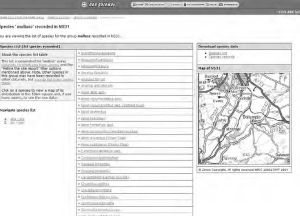
3. See what has been recorded in a 10km square – from the Home Page select the 100km square from the map at the bottom of the page. Then pick the 10km square you are interested in. You will then see a list of the species groups that have been recorded in that square. Click on the “Mollusc” link to see a list of the molluscs that have been recorded.
Note: For the present time, all this can be done using the public level of access (in the case of Conchological Society data this applies to access at the level of 10km square). If you want to access the full records you will also need to register and apply for that level of access. Although the mechanisms for this have been set up on the Gateway Website, the Society has yet to set up a registration system. Once this is in place further information will be communicated to the Membership via the magazine and on the Society’s Website.